Over at the Non Significance blog, the author describes the case of a paper that has some strange descriptive statistics:
What surprised me were the tiny standard deviations for some of the Variable 1 and 2, especially in combination with the range given.
In the blog post, the author outlines his approach to make sense from the descriptive values. It seems to be likely that the reported Standard Deviations (SD) are actually Standard Errors of the Mean (SEM). I’d like to add to this blog post one argument based on calculus and one argument based on simple simulations to show that SEM’s are indeed much more likely than SD’s.1
In fact, the reported standard deviations should be impossible given the mean and the range of values: Even, if all values, except the two bounds given in the range, were exactly the same value as the mean, the standard deviation would be for the case of Variable 1 (pre) 1.24((Note, that the mean of the sample is, of course, then different. But as we are only interested in the lower bound of dispersion, this is irrelevant here.)) – which is notably larger than the published standard deviation (0.36), but smaller than the calculated standard deviation (1.65) if it was the standard error of the mean.
To further underline, that the values are more likely if they were standard errors, I have performed quick simulations.2 The simulations will be shown for Variable 1 (pre), but procedure and results are similar for the other three variables. Further, I did not include any dependencies between the variables, which should not change the results.
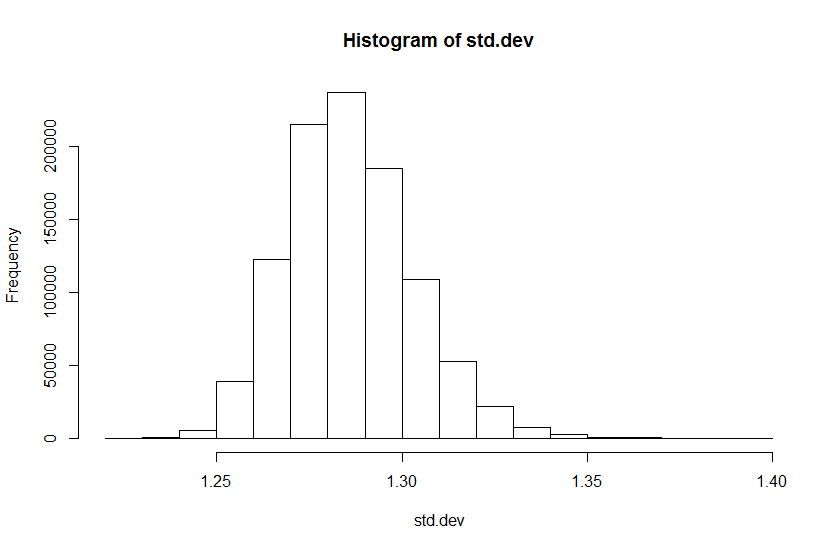
Our simulated sample will consist of the given minimum and maximum values (2.59 and 10.04) and N-2 = 19 items randomly drawn from a normal distribution with mean = 7.60 and standard deviation = 0.36. All values will be bounded by acceptance/rejection to values between 2.59 and 10.04 and rounded to two decimal digits.
Performing 1,000,000 simulations this way, we find that zero samples have standard deviations as small as the reported or smaller – this is expected from above calculations. The following histogram shows the distribution of standard deviations from the simulated samples.

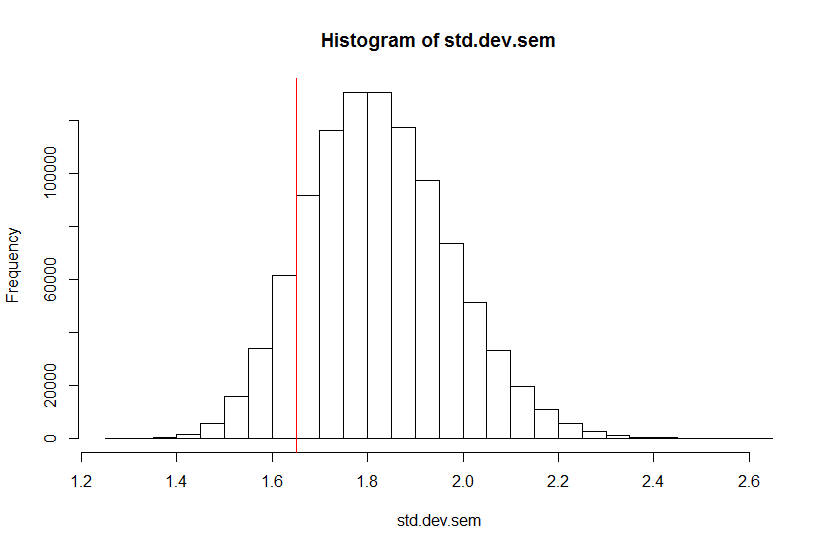
Performing the same simulation with samples from a normal distribution with the reported mean and the reported standard deviation as the standard error of the mean (, i.e. 1.65), we see 117,961 of 1,000,000 simulated samples with standard deviations as small as the reported one or smaller (11,79%). The median standard deviation is 1.82. Again the histogram shows the distribution of standard deviations in our simulation (red line indicates the calculated standard deviation based on the reported value as SEM):

The same pattern results from simulations for the other variables. Based on these considerations, I would strongly assume that the authors of the original paper mistakenly have reported standard errors as standard deviations. A mistake, that is not so uncommon.[citation needed] It is notable, however, that for Variables 3 and 4 the analysis yields different results: the published values do make sense as standard deviations.
This case is another example how openly shared data can help to improve the validity of scientific publications. Mistakes happen and that is not so much of a problem, if they are easy to identify and to correct.
Please note, that I do not know the original paper, so the paper might contain further information on the nature of the reported number that could influence the arguments presented herein. Please refer to the blog post at Non Significance for the “raw” data used in my arguments.
- Since the original paper is not cited to protect both the original and the blog author, I can base my arguments only on the descriptive statistics published in the blog post. See also last paragraph. ↩
- The corresponding R scripts are available on GitHub. ↩
Leave a Reply